About paper
Czech originalMeasurements of stopping distance of a car
This contribution describes a set of students’ activities – video measurements of stopping distances of a car from various initial speeds. Motivations for these activities are students’ wrong notions of the dependency of the stopping distance of the car on its initial speed and mainly the high share of young drivers in traffic accidents. These activities can be carried out not only at physics lessons but also during special exercises aimed at safety.
Video measurements
Video measurement or video analysis is a measurement in which we use a video recording. We inspect the dependence of position, velocity or acceleration of the chosen object on time in the recording. The result of the video analysis is usually a plot of the dependence of mentioned kinematic quantities on time. We can either realize video measurements with video recordings prepared in advance or we can record our own videos during classes and then analyze them. Many of our colleagues have dealt with video analysis; let us mention the works of Lepil [1] or Ješková and Kireš [2]. We can find nice suggestions in Jílek [3], Demkanin provides instructions for the work with the Coach program [4]. Directions for video measurements of the free fall can be found also in [5] and [6]. The program called Tracker is popular nowadays, relevant proposals can be found in Duľa [7].
Students’ notions of the vehicle stopping distance
Many students begin driving a car at a very young age. One of the very frequent causes of young people’s serious road accidents is the high speed that does not correspond to their driving skills and experience. Insurance companies have information on the accident rate of young people and one of these companies stopped taking out insurance with drivers younger than 24 years for this reason [8]. Our experience shows that most students lack a good notion of the distances required for a car to stop from different speeds. This fact has been evidenced by two short tests concerning the students’ notions of the dependence of the stopping distance of a car on its initial speed. We assigned the test to a group of 17–19 years old students. The students were asked to fill out a table of stopping distances of a car from various initial speeds. We asked for “net” stopping distances disregarding the reaction time of the driver.
The task was assigned to 17 students at once. 9 of them gave considerably shorter distances than they are in reality. The deviations were most distinct for high initial speeds. The students thought that a car going 80 km/h could stop at the distance of 10 – 20 meters.
The second test was very similar. We indicated to the students that the stopping distance from 40 km/h is 8 meters. The students were assigned to fill in the remaining stopping distances in the table.
| Initial speed |
Stopping distance |
| 20 km/h |
m |
| 40 km/h |
8 m |
| 60 km/h |
m |
| 80 km/h |
m |
| 100 km/h |
m |
| 50 km/h |
m |
Tab. 1: The students were assigned to complete the table.
The test was taken by the same 17 students. The results show that most of these students have wrong notions of the stopping distance. They declared that it depends linearly on the initial speed. 14 students provided answers of this type. Thirteen of these gave distinctly shorter stopping distances from high initial speeds again.
Video analysis of car stopping distances
We use the Tracker program for a video analysis. The installation conditions and instructions for the Tracker program as well as a detailed guide for stopping distance measurements can be downloaded from the web of the conference “Šoltés days 2010” [9]. Some parts of the manual and certain figures were taken to this text from there.
For our particular activity of measuring the dependence of the stopping distance of a car on its initial speed, we use video recordings that were prepared as a part of the diploma thesis of Andrej Karlubík [10]. The author of this thesis prepared his recordings on a horizontal road on an airfield. Braking of a car from five different initial speeds between 20 km/h and 100 km/h was recorded. Initial speeds were measured (estimated) with the car’s speedometer (initial speeds measured from the video recordings are somewhat lower). The driver did his best to start braking at the same spot every time – the edge of the camera view was aimed at this spot. The width of the camera view was set so that it covered the whole stopping distance of the car from the highest initial speed.
We have five recordings available, each with a different initial speed of the car. Students (in groups) are assigned to do a video measurement with each of the five recordings and to display position-time graphs.
We use the length of the car, which is 4.5 meters, to calibrate distances for a video analysis.
The students are assigned to calculate the total stopping distance of the car from the position-time graph and its initial speed from the speed-time graph.
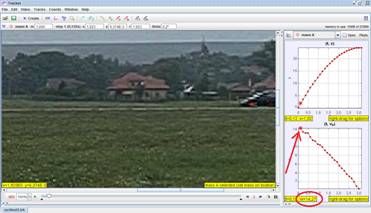
Fig. 1 We evaluate the initial speed of the car from the speed-time dependence. The initial speed of the car is approximately 14 m·s–1 in this case.
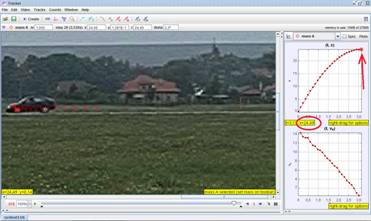
Fig. 2 We evaluate the stopping distance of the car from its position-time dependence which is approximately 25 m in this case.
Students are assigned to complete a table of the dependence of the stopping distance on the initial speed. There is the initial speed in m·s-1 in the first column, the initial speed in regular traffic unit which is km·h-1 in the second column and students write down the stopping distance in meters in the third column. They are assigned to draw a graph of the dependence of the stopping distance on the initial speed of the car on the basis of these values.
| Initial speed |
Initial speed |
Stopping distance |
| m·s–1 |
km·h-1 |
m |
| 0 |
0 |
0 |
| 5 |
18 |
2.5 |
| 9.6 |
35 |
10 |
| 14 |
51 |
25 |
| 18 |
66 |
44 |
| 23 |
82 |
72 |
Tab. 2 Measured values of initial speeds and stopping distances of a car
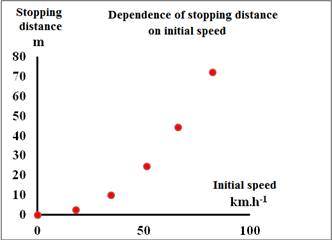
Fig. 3 Graphical adaptation of measured results – dependence of the stopping distance of a car on its initial speed
We should focus on the non-linear, quadratic, dependence of the stopping distance on the initial speed in the discussion with students. This resulting quadratic dependence could have been expected. It stems from the formula for kinetic energy. If we presume a constant braking force, we can see that the dependence of the stopping distance on the initial speed should be quadratic.
We should also point out the actual values of the car stopping distances at various initial speeds. We should warn students that we have measured net stopping distances disregarding the driver’s reaction time. We put the strongest emphasis on the importance of observing safe speed limits. We can clearly see from the graph that when we drive 60 km·h–1 on a road section with 40 km·h–1 speed limit then our (net) stopping distance is more than two times longer than when we observe the speed limit.
Conclusion
The activity is proposed as a student experiment. Students who perform it are obliged to find information in the text, they acquire and process data form measurements, and analyze data from graphs; a synthesis of data follows with an explanation of the dependence of stopping distance on initial speed.
The activity can be realized not only during physics lessons but also as a part of a course of man and nature protection. A similar activity could be realized with a bicycle. We could measure the dependence of stopping speed of the bicycle on its initial speed directly in the field.
Acknowledgements
This contribution was made as a part of the solution of the project APVV LPP 0251-09 “Natural Sciences in School Education Programs” (“Prírodné vedy v školských vzdelávacích programoch” in Slovak). The budget of the project covered the expenses related to the participation on the Physics Teachers’ Inventions Fair. We also thank Miroslav Šedivý for his technical aid during the preparation of presented activities.
References
[1] Lepil O.:K vývoji didaktické komunikace ve výuce fyziky. In: Zelenický Ľ. (ed.): Zborník z konferencie Didfyz 2004. Nitra, FPV UKF a JSMF, 2005, s. 5-10.
[2] Ješková Z., Kíreš M.: Videomerania fyzikálnych javov v prostredí IP COACH. In: Zelenický, Ľ. (ed.): Zborník z konferencie DIDFYZ 2004 Nitra, FPV UKF a JSMF, 2005, s. 202-207.
[3] Jilek, M.: Několik nápadu nejen z kroužku fyziky. In Svododová, J., Sládek, P. (ed.): Sborník z konference Veletrh nápadu učitelu fyziky 9, sv. 2. Brno, Paido, 2004, s. 50-51.
[4] Demkanin, P. 2006. Počítačom podporované prírodovedné laboratórium. Bratislava: FMFI UK, 2006.
[5] Horváth P., Šedivý M.: Analýza mechanického pohybu videomeraním. In: Horváth, P. (ed.): Zborník príspevkov „Aktivity vo vyučovaní fyziky“, Smrekovica. Bratislava, FMFI UK, 2006. s. 69-77.
[6] Horváth P., Šedivý M.: Videomeranie tiažového zrýchlenia. In: Horváth, P. (ed.): Zborník príspevkov „Šoltésove dni 2006“, Bratislava, FMFI UK, 2007, s. 31-38.
[7] Duľa Možnosti využitia programu Tracker na hodinách fyziky. In: Zborník z konferencie Tvorivý učiteľ fyziky, Smolenice 2009. s. 35-39, dostupné na http://sfs.sav.sk/smolenice/prispevky.htm
[8] https://poistenie.csob.sk/pzp/Strana2a.aspx
[9] http://fyzikus.fmph.uniba.sk/typo/index.php?id=575
[10] Karlubík A.: Videomerania vo vyučovaní fyziky, diplomová práca. Bratislava, FMFI UK 2010