About paper
Czech originalPhysics on Travels and in the Field
Abstract
The contribution is divided in two parts. In the first one we show how to use interesting photos from travels in physics education. The second part is focused on suggestions on physical measurements for students on travels – for example on the train.
1 Photos from travels in physics education
1.1 Introduction
Travelling is an attractive activity for most people. We travel not only round our country but also to more or less distant corners of Europe and possibly around the whole world. Anyway, we bring home digital cameras (built in our mobile phone) packed with photos. And we can possibly meet some physically interesting things on travels (unusual technical devices, atmospheric phenomena etc.). Photos of such things can be used in physics education. After all, students can boast of their travels and what they caught on camera themselves and prepare a question that concerns the curiosity they captured, not only us teachers. It is particularly opportune to encourage students leaving for summer holidays to take physically interesting photos on their travels. We can even announce a competition. In this section we give three proposals of work with photos from travels.
1.2 The train from Beijing to Lhasa
Introduction: A few years ago the railway from the city of Qinghai to the Tibetian city Lhasa was finished and put in commission in China (see reference [1]). Thanks to it we can get to Lhasa even from the 4000 km distant Beijing, the capital of China. The newly built section of the railway is more than 1100 km long and can boast of a couple of curiosities. More than a half of the new section is built on permafrost, the permanently frozen ground, which is linked to the fact that the railway is found in a high altitude. The following question is also linked to this fact.
Question 1: Asses roughly the altitude to which the train called “The Rocket to the Roof of the World” has climbed according to the photograph of the barometer (Fig. 1)
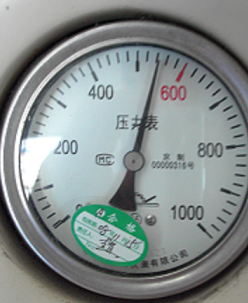
Fig. 1 Barometer in the train to Lhasa
Solution and Answer 1: It is well known that the atmospheric pressure drops with increasing altitude. Presuming that the pressure in the train is the same as outside, we can find out the altitude using Math-Physics-Chemistry Table [2].
The barometer shows approximately 540 hPa (the unit is not written in roman letters but it is most probably hPa). The table says that the pressure 533 hPa (the nearest value listed in the table) corresponds to an altitude of 5000 m. The train has climbed to an altitude around 5000 m.
Note 1: The result corresponds well to the fact that the picture of the barometer was taken near to the highest point of the railway that is found at an altitude of 5072 m (see reference [1]). It means that a part of the railway lies higher than the peak of Mt. Blanc. We can say that it is located “above Europe”.
1.3 An interesting device from Tibet
Introduction: We arrived to Tibet in the previous subsection, so let us stop there for a moment. In addition to Buddhist temples, the world-famous seat of Dalai Lamas of Potala, we met also an interesting device in September 2008 (see Fig. 2).
Question 2: What does the device photographed at the courtyard of the Buddhist temple (Fig. 2) serve for?
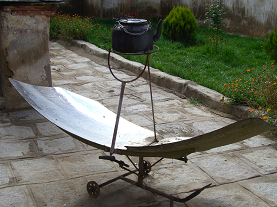
Fig. 2 An interesting device from the Buddhist temple
Solution and Answer 2: The device can heat water for tea in the kettle placed above it. The curved mirror below the kettle probably concentrates sun rays to the focal point that may be located on the bottom of the kettle.
Note 2: When we were close to the kettle we could hear fizzing of the steam bubbles in the water. The water can apparently be brought to the boil in the kettle. (Physical tables say that the air pressure at an altitude of 3500 m is about 649 hPa and that the boiling point of water is about 88 °C at such pressure.)
1.4 The Dead Sea
Introduction: An interesting body of water is located along the border between Israel and Jordan – the Dead Sea. Apart from the fact that its banks are the lowest-lying pieces of dry land on Earth (it is stated that they lie about 400 m below the sea level – see reference [3]), it is remarkable for being very salty. (It contains about 10 times more salts than average sea water.) Magnesium chloride, sodium chloride and potassium chloride predominate among the salts (see reference [4]). We can see some of the consequences of high salinity on the following photographs.
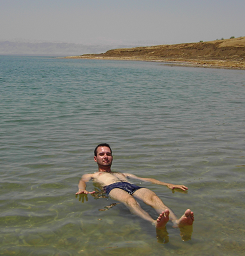
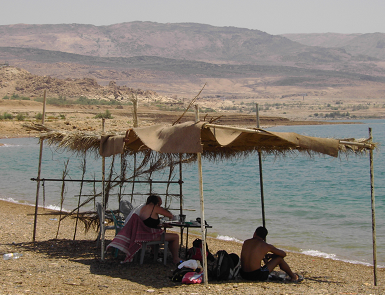
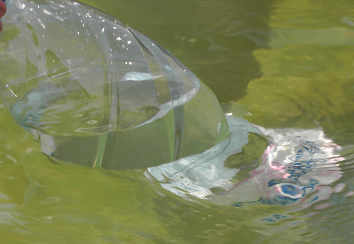
Figures 3 to 6 The Dead Sea and the neighbourhood (Jordan territory)
Question 3: There is an open plastic bottle with some drinking water being freely held upright on the surface of the Dead Sea on the photo (Fig. 5). What does this demonstration prove?
Solution and Answer 3: The column of drinking water in the bottle reaches higher than the surface of the Dead Sea water which means that the density of drinking water is lower than that of the Dead Sea water (if we can neglect the influence of the plastic bottle).
Note 3: We can verify the negligibility of the plastic bottle weight experimentally. We pour some drinking water in a plastic bottle and hold it freely upright in a bigger vessel with drinking water (a bucket for example). We see that the surface of water in the bottle is almost at the same height as the surface of the surrounding water in the bucket.
Question 4: What portion of the man in figure 3 is floating above the surface of the Dead Sea?
Solution and Answer 4: You can use the law of Archimedes and look up the density of water and body. The average density of the Dead Sea water is about 1230 kg·m-3 (see reference [5] for example) and the average density of human body is 985 kg·m-3 (see reference [6] for example). Calculation yields that the ratio between the volume V of the whole body and the volume V0 of its immersed portion is \( \frac{V}{V_0} \approx 1.25 \) which means that about one fifth (not a quarter!) of the man’s body is above the water surface.
2 Physical measurements carried out when we travel
2.1 Introduction
We can use not only pictures from travels in physics education as we indicated above, but we can also encourage students to do physics directly on the way. We will give a simple example in this section.
2.2 Physical measurements on the train
Introduction: When we go by train with students (possibly on a school trip) or when they go by train themselves (when they commute to school for example), they can do simple but interesting measurements. We can assign the task in the following way:
Question 5: Determine and put down the dependence of the distance travelled by the train that you ride on time.
Solution 5: We can notice milestones along the railway that indicate the distance from a certain point on the track. Some milestones (in the Czech Republic) are distant 100 m from each other; others are placed each 200 m. The latter applies for new railway corridors. The distance markers on the railway corridor IV (between Prague and České Budějovice) are placed on trolley posts.
We can use stopwatch in a mobile phone for example. Some mobiles offer a stopwatch with lap timing functionality that allows to save several (sometimes even several tens of) subsequent lap times. We can do the measurement while we sit at a window in the train and save a lap time each time when we notice a distance marker on the post or a milestone.
Table 1 shows the data measured on the fast train from České Budějovice to Prague between Veselí nad Lužnicí and Tábor
| \( \frac{s}{\mathrm{m}} \) |
0.2 |
0.4 |
0.6 |
0.8 |
1.0 |
1.2 |
1.4 |
1.6 |
1.8 |
2.0 |
| \( \frac{t}{\mathrm{s}} \) |
6.77 |
12.89 |
18.73 |
24.66 |
30.71 |
37.85 |
42.74 |
48.99 |
55.30 |
62.38 |
Tab. 1 Dependence of the distance travelled by a fast train on time (distance s is 0 m at time t = 0)
Question 6: What is the average speed of the train in the measured section?
Solution and Answer 6: We get the average speed as the ratio of the total length and the total time of the ride. In our case we obtain \[ v_{avg} = \frac{2\,\mathrm{km}}{62.38\,\mathrm{s}} \approx 32.1\,\mathrm{m\,s^{-1}} \approx 120\,\mathrm{km\,h^{-1}} \]
Question 7: What is the maximum instantaneous velocity during the given motion?
Solution and Answer 7: We calculate the instantaneous velocity as the average speed between two adjacent points (we have values for 200 m long stretches of the way). It is apparent from table 1 that the minimal time increment is between 1.2 km and 1.4 km. The time increase is \(\Delta t = 42.74\,\mathrm{s} - 37.85\,\mathrm{s} = 4.89\,\mathrm{s} \). Maximum instantaneous velocity is then \( v_{max} = \frac{0.2\,\mathrm{km}}{4.89\,\mathrm{s}} \approx 40.9\,\mathrm{m\cdot s^{-1}} \approx 150\,\mathrm{km\cdot h^{-1}} \).
Note 7: It is naturally possible that the instantaneous velocity reached even a higher value at a certain point. Our “maximum” is determined from the available data.
3 Conclusion and other suggestions
The use of photos from travels can significantly awaken an interest in physics education and liven up physics lessons. Several photos of the author (including questions for thought) are publicly available at the address http://kdf.mff.cuni.cz/~zak (marked as as PHYSICAL PHOTOGRAPHS FROM TRIPS in the menu on the left).
As for the physical measurements on the train or other means of transport, we can determine also the acceleration or deceleration on the basis of the variation of the velocity in time. If a measurement (measuring the speed in a section of the way for example) is done by a sufficient number of students, we can use the obtained values to train statistical processing of measured data (calculation of arithmetical average, absolute and relative error of the measurement). We should also pay some attention (according to the age and experience of our students) to proper rounding of the results (in our case we rounded all results to two digits).
References
[1] http://www.chinatibettrain.com/
[2] Mikulčák J. a kol.: Matematické, fyzikální a chemické tabulky. SPN Praha, 1988.
[3] http://de.wikipedia.org/wiki/Totes_Meer
[4] http://cs.wikipedia.org/wiki/Mrtvé_moře