About paper
Czech originalFrom the Work of the Laboratory of Young Physicists at the Faculty of Science of Masaryk University
In this contribution we introduce two measurements that were carried out at the Laboratory of Young Physicists. The first measurement deals with the distribution of electromagnetic field in a microwave oven. The second one concerns thermal insulation of buildings – we compared the surface temperature of walls of blocks of flats with and without additional insulation.
Study of Spatial Distribution of Radiation in Microwave Oven
In this experiment we dealt with the question of spatial distribution of nodes and anti-nodes in a microwave oven.
History
The thermal effects of microwave radiation were discovered accidentally by an American Percy Lebaron Spencer in 1946 when a bar of chocolate melted in his pocket while he was working on improvement of a military radar magnetron. The first microwave oven was placed on the market as early as in 1947 but it was very expensive and weighed 400 kg so it was used only in restaurants and on ocean liners. Household microwave ovens that would be small and cheap enough for a wider public use began to emerge in the sixties. Even though the microwave oven is a part of the most households nowadays it is still a subject of development that aims mainly at more homogeneous heating of the content.
Principle
The most important part of the microwave oven is a magnetron – generator of microwave radiation. The frequency of this radiation is 2.45 GHz which is near to the resonant frequency of some molecules such as the water molecule. The interior of the oven is made of metal that completely reflects the microwave radiation. Thanks to the inner dimensions of the oven that are in half-multiples of the radiation wavelength (which is 12.24 cm for 2.45 GHz) there forms a standing wave in the oven. Polar molecules are sensitive to the polarity of the wave; they follow its change and rotate, heating up their surroundings by friction. The change of the polarity is the largest in anti-nodes of the standing wave and this is why the temperature is the highest there. On the contrary there is almost no temperature change in the nodes of the standing wave. The producers try to deal with this non-uniform distribution of heating by various means such as placing the dish on a rotating plate or using radiations of two different frequencies. The second solution increases the number of anti-nodes.
Measurement
We based our measurement on the assumption that the temperature will be the highest in the anti-nodes while it will increase only slightly in the nodes.
We can use many methods to evaluate the temperature. The simplest is a reversible heat sensitive foil. It can provide information on the distribution of temperature in the whole range from the node to the anti-node but it is not suitable enough for detection of exact position of the anti-nodes themselves because manipulation with the foil distorts detected values and the foil cools down quite fast and the data disappear. Another disadvantage of this method is that one foil allows us to obtain information only from one section in the oven during one measurement. If we want to find out spatial distribution of the anti-nodes, we must repeat the experiment many times with the foil in different positions. The data from individual measurements may by incomparable due to unequal cooling of the foil.
Therefore we decided to use paper covered all over with special heat-erasable ink[1] that disappears when heated to 60°C. In contrast with the previous method, the measured data remain on the paper. We do not have to evaluate them quickly and we can measure many parallel sections at once. We put a 2 cm thick extruded polystyrene foam (XPS) board between every two detection pieces of paper and thus we obtained horizontal or vertical sections of the internal space of the oven with 2 cm spacing (see Figure 1).
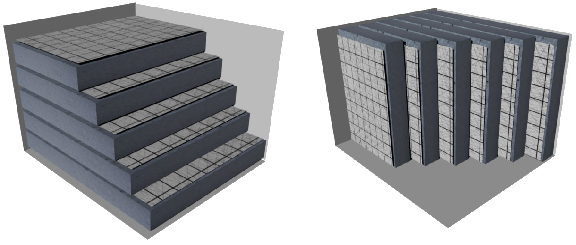
Fig. 1: Arrangement of detection pieces of paper in the microwave oven for horizontal (left) and vertical (right) sections of the microwave field
We do not obtain exact distribution of the temperature as in the case of heat sensitive foil but only a map of places where the temperature exceeded 60°C. It is good to mark a reference point on each piece of paper from which we then measure the positions of anti-nodes and followingly we have to pay attention to the alignment of the pieces of paper according to the reference points. (This is important mainly if we want to plot the data from all sections in one system of coordinates.)
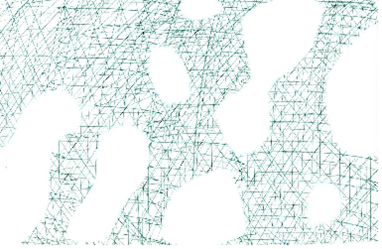
Fig. 2: Measured data
Data processing
It is convenient to put the data in a three-dimensional model to get a better picture of the real distribution of the field in the microwave oven. The simplest possibility is to redraw the borders of heated areas on transparent foils or glass plates and arrange them in space but it would be quite complicated if we wanted to merge vertical and horizontal data. Another possibility would be to create a three-dimensional model from some material such as XPS. We decided to process the data on a computer in the program Blender[2].
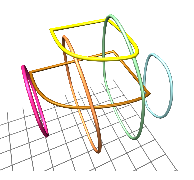
Fig. 3, 4: Details of some anti-nodes
First, all papers with data were scanned and a square grid was added to the pictures in an image editor. All sections were then redrawn one by one in Blender to make a three-dimensional model.
Experiment evaluation
We can see certain regularity in the standing wave in the model. We can estimate its wavelength from the upper part of the model (which is found near to the magnetron) where the regularity is not influenced by so many reflections. Unfortunately, we can also see various errors of the measurements – some anti-nodes present in vertical sections are not present in horizontal sections, for example.
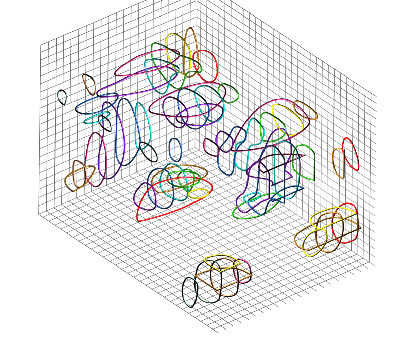
Fig. 5: A view of the computer model. Lines of the grid are spaced by 1 cm.
Measurement of the Surface Temperature of a Building
In our laboratory we were interested in the exact effect of thermal insulation on the insulating properties of walls of blocks of flats.[3] We decided to measure the temperature in different places of the enclosure wall with a contactless infrared thermometer. We measured the temperature both from the outside and the inside. Finally, we compared the values measured on the insulated and non-insulated parts of the wall.
We had to pay a special attention to the emissivity of measured surfaces when using the infrared thermometer. The thermometer measures the intensity of infrared radiation that falls on the sensor and then calculates the temperature using entered emissivity (the ratio between emitted and reflected radiation). Emissivity is very close to unity (emissivity of a black body) for most non-metallic opaque surfaces. Yet it is very different for a glass window or a non-painted metal handrail. For finely polished metals it is even close to zero.
Table of emissivity
| paint |
0.96 |
| asphalt |
0.93 |
| paper |
0.93 |
| glass |
0.92 |
| plaster |
0.92 |
| brick |
0.90 |
| concrete |
0.85 |
| sand |
0.76 |
| polished steel |
0.07 |
| polished copper |
0.03 |
We can use an average value for all materials the emissivity of which varies in the range of one tenth. The difference in measured temperature is negligible.
Measurement
The measurements were carried out on 8th January 2009 at 5 pm in Brno, Oblá estate in a flat that had one insulated and one non-insulated enclosure wall. The temperature in the flat was 20.5 °C, outside -14.5 °C, wind speed almost zero. Windlessness was very important for the measurement because the wind would cool the walls unevenly and alter the results.
Measured values:
| Insulated enclosure wall - outside |
-15.0 °C |
| Insulated enclosure wall - inside |
19.6 °C |
| Non-insulated enclosure wall - outside |
-11.0 °C |
| Non-insulated enclosure wall - inside |
17.1 °C |
| as a matter of interest: |
|
| cellar window – two glass panes |
-10,0 °C |
| cellar window – one pane broken |
-5,0 °C |
| plastic window |
-11,0 °C |
Conclusion
The surface temperatures of an insulated enclosure wall are very close to the neighbouring air temperature (both outside and inside) while there is a significant difference between the surface temperatures of a non-insulated wall and the neighbouring air (both outside and inside). This difference is caused by heat penetration and affirms the assumption of bad thermal insulating properties of a bare (plastered) concrete wall. Measured differences show quite clearly that insulation distinctly improves the insulating properties of enclosure walls.
[1] http://www.pilotpen.us/ProductGroup/28-FriXionBall.aspx?ProductId=90
[2] http://www.blender.org
[3] Translator’s note: Additional insulation of older prefabricated blocks of flats with XPS boards is quite common in the Czech Republic.