About paper
Czech originalSuperbright LED
The first light emitting diodes made in the Czech Republic occurred in the TESLA catalogue in 1980s. The first in the series was LQ 100. It shone with red light. In the catalogue we read the following information
Luminous intensity 0,8 ≥ 0,2 mcd
Current 20 mA
Voltage 1,65 ≤ 2 V
Wavelength λmax 660 nm
Only the elder can remember the ruby-colored diode with gold-like casing depicted in Figure 1.
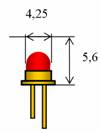
Fig. 1 Czech LED TESLA LQ100
The PN transition capable of emitting photons was created in GaAs. Although the diode shone red, the light was not even far monochromatic. The FWHM of the spectral characteristic was about 150 to 300 nm [1].
GaP (gallium phosphide) diodes without any dopants shines green with a maximum at 565 nm and yellow light can be obtained by introducing tellurium, zinc and oxygen into the semiconductor. The blue diodes had a PN transition in SiC (silicon carbide) and dopants like nitrogen, aluminium and boron shifted the dominant wavelength of the diode between 458 nm and 620 nm [1].
The process that emits photons is recombination of an electron that was injected from the N-type semiconductor into the P-type, where it meets a hole. Only less than a tenth of all recombinations produce a photon; the rest of energy that was not transformed into light is given to the lattice as heat.
More than thirty years of research significantly changed the properties of LEDs – today’s values of luminous intensity are four orders higher with the same input power. We show some examples from the catalogue of OSHINO Lamps:
Type SUR 50010, InGaAlP red λmax = 641 nm, Current I = 20 mA, Voltage U = 1,9 V, Luminous intensity 7 400 mcd
Type SUY 50010, InGaAlP yellow λmax = 590 nm, Current I = 20 mA, Voltage U = 2,0 V, Luminous intensity 6 200 mcd
Type SPG 50020, GaN green λmax = 523 nm, Current I = 20 mA, Voltage U = 3,5 V, Luminous intensity 7 000 mcd
Type SUB 50010, GaN blue λmax = 470 nm, Current I = 20 mA, Voltage U = 3,5 V, Luminous intensity 2 500 mcd
Type SUW 50010, GaN white Current I = 20 mA, Voltage U = 1,9 V, Luminous intensity 20 000 mcd, color coordinates x = 0,30, y = 0,30
All the types mentioned above are constructionally very similar to the diode shown in Figure 2.
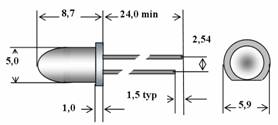
Fig. 2 The casing of a contemporary LED
The high luminous intensity is boosted by concentrating the luminous flux into a small emissive angle as we can see in the polar graph of luminous intensity (Figure 3).
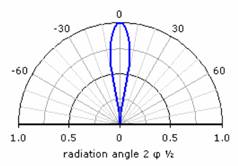
Fig. 3 Polar graph of luminous intensity of a modern LED
The information above is adopted from the web page [2].
It is necessary to know the maximal input of these diodes if we want to experiment with them – overheating leads to a decrease of luminous intensity and further to destruction of the diode. The producer recommends only 100 mW. There is no danger of overheating if we keep the current at recommended 20 mA. We can use a DC source and an appropriate resistor in a serial circuit with the diode. Another simple circuit with a transistor running with a 9 V battery (Figure 4) allows us to keep the current in desired range.
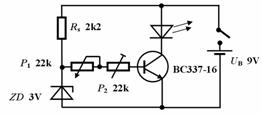
Fig. 4 Supply circuit for a LED
The voltage across the Zener diode ZD is virtually constant and the potentiometer P1 allows us to regulate the base current and thus the drain current. The trimmer P2 sets the maximal current through the LED. We set it at 25 mA. The changes of the battery’s voltage have only a small effect on the operation of the source and the voltage drop on the LED is not substantial. The source is built in a plastic box with a switch, two sockets for the LED and the button of the potentiometer P1 led out on its front side.
Color LEDs can serve to demonstrate color composing. Figure 5 shows three diodes cased in simple probes emitting blue, green and red light. There can be seen yellow, cyan and magenta areas on the shade. We can create also white light by regulating the current through individual diodes.
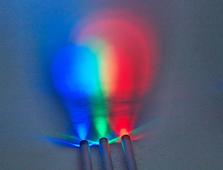
Fig. 5 Color composing
The light emitted by a LED is not even far monochromatic. We used the objective from an old magnifying device MAGNIFAX and an optical bench shown in Figure 6 to study the spectrum of the LED.
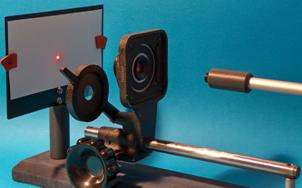
Fig. 6 Optical bench
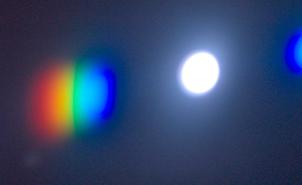
Fig. 7 Spectrum of white LED
The red filter that was a part of equipment of the magnifying apparatus was replaced by a transparent CD which serves as the optical grid now. We can change the size of the image by moving the objective and the probe. The spectrum of a white LED is shown in the Figure 7.
The iris diaphragm of the MAGNIFAX objective was fully opened for photographing. But it is good to close the iris as much as possible if we want to study the spectrum by eye. It is apparent from the picture that the white LED emits all visible wavelengths. The spectrum of a yellow LED is shown in Figure 8.
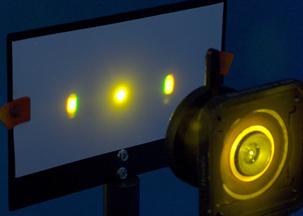
Fig. 8 Spectrum of a yellow LED
There can be seen both the red and the green component of the light that we subjectively perceive together as yellow. The observation of spectra can be extended by measuring the wavelengths. We can use a laser module with the wavelength 650 nm powered by a 3 V source made of two dry cells to calibrate the optical bench and turn it into a basic spectrometer.
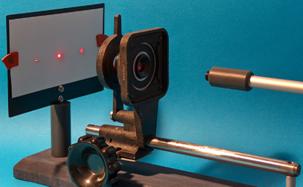
Fig. 9 Setting of the size of the image by a laser
It is suitable to set the grid and the objective so that the distance of sharp maxima of the 1st and 0th order is 65 mm (Figure 9). Then we simply replace the laser with our LED, let the objective in position and sharpen the image of the 0th order by moving the diode to an appropriate distance from the objective. The distance of each light component in the 1st order maximum multiplied by 10 gives the wavelength of the component in nanometers.
This calculation is not absolutely precise as we can see from a simple analysis of the system in Figure 10.
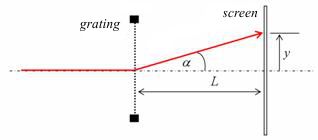
Fig. 10 The position of the 1st order maximum
The picture shows that the distance of the 0th and 1st order maxima is \( y = L \mathrm{tg} \alpha \). The angle of projection of the 1st order maximum of a grid with constant a is \(a \sin \alpha = \lambda \). From here we read \(\sin \alpha = \frac{\lambda}{a} \) and for small angles (below 5°) we can substitute tangent with sine functions. Then the deflection is \( y = L \frac{\lambda}{a} \). The angle reaches the values of 25° in our measurement so we cannot neglect the difference of sinus and tangent so easily. A calculator yields values of
tg 25° = 0.4663 and
sin 25° = 0.4226 .
The relative error of the values is 10 % and the same error must be taken into account when reading the wavelengths directly from the shade. Yet, such a mistake is allowable for an informative measurement of the wavelength.
A white LED with luminous intensity of 20 cd is usable to make a model of a light guide (an optical fiber – Figure 11). A transparent plastic hose was filled with silicon oil. One end of the hose was plugged with the source diode, the other end was plugged by a transparent plug (we used a piece of a clear LED with diameter of 3 mm).
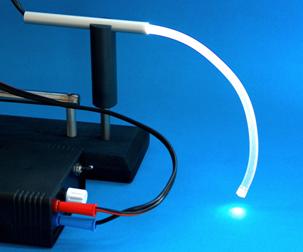
Fig. 11 A model of a light guide
The condition of total reflection is not fulfilled for all rays emitted by the source diode, so we can observe losses along the light guide. The intensity of the light going out of the other end of the hose changes if we bend the hose.
We can also use the LEDs to observe luminescence effects.
Today’s safety instructions demand that the exits and emergency paths are equipped with labels that are visible also in the case of a blackout. Various producers provide signs, labels and symbols made of modern luminescence materials with relatively high brightness and a long duration of luminescence after enlightenment (in tenths of minutes). In the following experiment we used a target of 50 mm in diameter. Red, green and blue LEDs show an interesting effect: only the blue diode leaves a luminescence trace. This is proved in Figures 12 to 15.
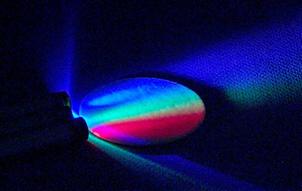
Fig. 12 Three LEDs shining on a luminescence target
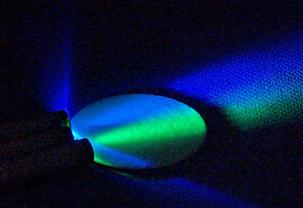
Fig. 13 Red LED off – no luminescence apparent
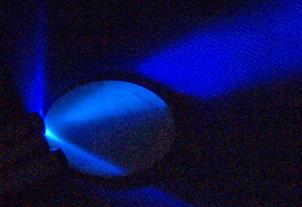
Fig. 14 Red and green LEDs off – no luminescence apparent
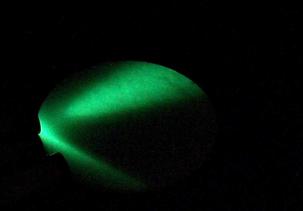
Fig. 15 All LEDs off - luminescence takes place in the area enlightened previously by the blue LED only
LEDs emitting ultraviolet light are today commonly available, too. The range of emitted wavelengths is quite wide and we can see the LED shining also in the visible part of the spectrum (Fig. 16).
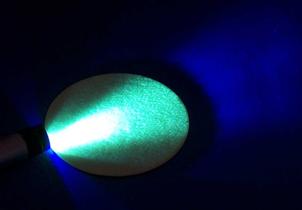
Fig. 16 A UV LED shining on the luminescence target
After we turn off the ultraviolet LED, there appears an intensive luminescence trace on the target.
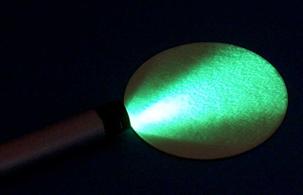
Fig. 17 Luminescence trace left by an ultraviolet LED
Superbright diodes are commonly accessible and the experiments with them are physically interesting, safe and aesthetically impressive.
The laser diode can be used for one another purpose. Physics and optics are also involved in producing sparkly packaging of many goods. Figure 18 shows reflection of a laser beam on a piece of the packaging of some cosmetic.
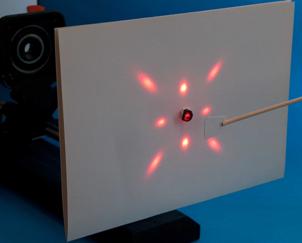
Fig. 18 Reflection of a laser beam on a piece of a cosmetic container
A slip of the packaging returns the maximum of the 0th order back on the laser diode, the other symmetrically arranged maxima remind a lauegram. Such picture is probably created by two perpendicular grids placed in two layers. It is possible that students will try to study cosmetics with laser pointers after this demonstration.
The broad accessibility of digital cameras makes it possible for the students to obtain their own recordings of the experiments and to work with them further.
References
1. Svečnikov, S. V.: Základy optoelektroniky, SNTL Praha 1975