About paper
Czech originalHigh-tech at Arm’s Reach
Thanks to the growth of today’s technology, more and more high-tech equipment and materials are finding their way into the life of adults and children. Almost every household now has compact disks (CDs), TV remotes and electronic scales. These and many more tools should also take their place in physics classes. They could supplement experiments completed with special tools and machines which have little relation to children’s everyday lives.
Here we present a few options of the school use of technologically complex tools, which are nevertheless well-known to children and easily accessible for them. We don’t intend to fully explain this technology, or to teach applied science. Let us focus on only a few of the basic questions and on using physical phenomena and laws to answer these questions. The tools used in these experiments are either ready-to-use modern technology, or they can be put together from everyday objects. Some of these experiments can be performed by the students themselves, either in groups at school or at home. We marked each experiment with a label which says if the experiment is suited for elementary school pupils (ES) or secondary school students (SS)
Experience from school teaching says that implementing modern technology can heighten the youth’s interest in physics, in understanding the impact physics has on life and work in today’s world and in their understanding of the technical world we live in, or to prevent fear and negative reactions. Furthermore, the use of modern technology in teaching physics offers the possibility of using knowledge from different areas of physics, sometimes even different subjects, and oftentimes even thinking about certain situations in life.
1. Hook-and-loop fasteners (velcro)
Lesson: Forces, tension
Equipment
a strong thin line approx 40 cm long (e.g. a fishing line), two aluminium plates, around 25nbsp;cm × 3nbsp;cm and 10nbsp;cm × 3nbsp;cm, the smaller one having a hole in the middle of it, with the diameter being around twice the diameter of the fishing line, double-sided duct tape or a suitable type of glue, stands, both parts of the hook-and-loop fastener (Velcro, in the Czech republic they’re called a ‘dry zipper’), a pad to soften the impact of our weight, a water-level
How does the hook-and-loop fastener (for example on a jacket or a shoe) work? Why do the parts stick to each other? The inspiration for Velcro comes from the fruits of certain plants, e.g. the burdock, which can stick stubbornly to the fur of animals. The parts of Velcro being put together have different properties. One part of Velcro is soft and quite fine, sometimes called the loop side. It looks a little like the fur of a poodle (fig. 1). The other part of Velcro has small hooks on it, which adhere to the loop side when pressed together. The hooks can look either like small fishing hooks, or little mushrooms (fig. 2).
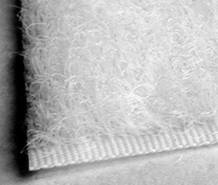
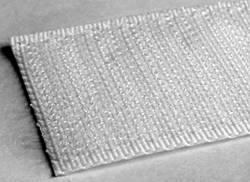
Fig. 1 (left) a 2 (right)
How can we measure the strength of a piece of Velcro? Let’s prepare a simple experiment with the proposed tools. Affix two hook-side pieces of Velcro to the smaller aluminium plate (fig. 3), with the hook side facing outwards. Glue or tape two slightly bigger parts of the loop-side pieces to the other aluminium plate. Feed both ends of the string through the hole in the smaller plate, so that the loop hangs downwards. Tie the free ends around the opposite edges of the plate and tie them together tightly. Then press the plates together with the Velcro parts against each other, put the edges of the bigger plate on two equally high stands and hang a weight from the loop (fig. 4). Make sure that the upper plate is level. Then put increasingly heavier weights on the loop of the lower plate until it detaches. Quite a large pull will be necessary, because there are a lot of hooks and loops connected.
If you research the relation between the surface area of the Velcro and the weight, under which it releases, you will find that the dependence is linear. A 1 cm2 piece of Velcro can, on average, withstand the weight of 125 g. The maximum force of normally used Velcro is lower, because it’s usually not in a level position. The strength of Velcro can be lowered by candle flame or dirtiness of the loop side, e.g. by rubbing cotton into it; this can be tried as well. Students and pupils can be motivated by the question: “Would it be possible to walk upside down on the ceiling using Velcro?”
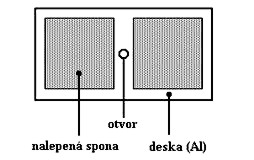
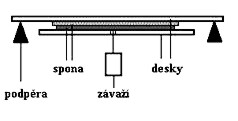
Fig. 3 (left) a 4 (right)
2. TV remote control
Electricity, optics – infrared devices (ES, SS)
Equipment
TV remote control working in the infrared spectrum, a matching TV receiver, boards made from various materials (glass, paper, fabric, wood, metals, plastic, etc.),
Or
a receiving diode or phototransistor, oscilloscope, 4.7 kΩ resistor, various interference filters, a 4.5 V battery
How can a remote control turn on a TV at a distance? – By pressing a button on the remote, it starts transmitting infrared radiation. Or more precisely, the transmitting diode connects one of many different oscillation circuits. the Infrared rays must fall on the receiver diode on the TV receiver, which in turn switches on a circuit of a certain TV station, or turns the TV off. Because the TV remote control is a source of infrared light at our fingertips, we can examine its properties, e.g. reflection, absorption, or even the wavelength and intensity. Infrared light is electromagnetic radiation, which has a wavelength slightly lower than visible light and these two are marked as the optical radiation spectrum.
Can infrared light reflect? – First, point the remote directly at the TV and turn it on. Then try to turn the TV off by aiming at the walls under specific angles. Does the TV turn on? Did, therefore, reflection occur? The light reflects only under some angles; these angles can be determined.
Does absorption of infrared light occur with some substances? – Put different materials between the transmitter and the receiver, e.g. normal window glass (3 mm thick), a sheet of paper, fabric made of woollen fabric, a metal plate, a wooden board, etc. When working with these materials and especially with metal, you must ensure that the beams don’t reflect from the object in question and then from the walls. It is therefore best to hold the objects as close to the receiving diode as possible. During the experiment, you will find that infrared light goes through glass, paper and woollen fabric and that it doesn’t go through the metal, wood and plastic. If you point the infrared light at a receiver diode connected to an oscilloscope, you can find out that glass lets around 80% of the radiation through, a sheet of paper lets through around 8% and wool lets through around 6% of the light. Metal and wood have zero permeability; metal reflects the light and wood, paper, and other materials absorb the light, either partially or fully.
Can you determine the wavelength of the transmitting device? – Using interference filters of known wavelengths put between the transmitting and receiving diode, we can determine the range of wavelengths which the diode uses. We can use the signal without any filter (100%) for comparison. The maximum intensity is between 920 nm and 1000 nm. By creating a circuit as in fig. 5 we can measure the relation between the intensity of the radiation (voltage measured by an oscilloscope) and the distance from the receiver. The intensity is roughly inversely related to the second power of the distance.
These experiments can be performed by students and pupils themselves, some of these as homework.
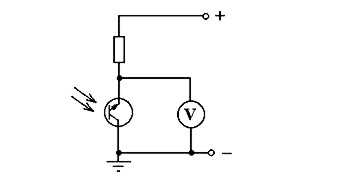
Fig. 5
3. Energy-saving light
Electricity, optics, efficiency: light, lighting (ES, SS)
Equipment
A compact fluorescent lamp (CFL), two stands with sockets and wires, a voltage source for the lamp, at least 3 normal lamps of various input, one of these should fit the energy saving lamp description, a photometer with a grease spot made at least 1 – 2 hours before the experiment
Warning! It is advised to use gloves while changing the lamps.
How does an incandescent and an energy-saving lamp work? In an incandescent lamp, electricity flows through a piece of metal wire, which after heating up emits light and heat. Most of the supplied energy turns into heat, which dissipates into the surrounding space. The fluorescent lamp is a low-pressure discharge tube, filled with mercury fumes and argon, inside of which gas-discharge occurs. The thus created ultraviolet radiation changes into visible light when passing through substances on the inside of the tube. These lamps are called compact because the whole process is (in contrast to normal fluorescent tubes) compressed to a very small space. Its efficiency (output divided by input) is, according to the manufacturer’s data, much higher than the efficiency of the average incandescent lamp.
Can the manufacturer’s claims be proven, if he says that for example his 15 W compact fluorescent lamp emits the same amount of light as a 75 W incandescent lamp? – You can prove or disprove this claim through a simple experiment. Screw an incandescent lamp in the socket on one stand and the CFL in the other, so that they’re at the same height. Then position them 1 meter apart from each other and put a measure between them with 0 next to the CFL. Then place a photometer between them so that the grease spot is at the same level as the incandescent and fluorescent lamp; you can hold it in your hand or you can put it in a separate stand, or use an optical bench. Lower the blackout curtains.
By moving the photometer between the two lamps the grease spot will look darker or lighter than the paper around it (fig. 6). Between these two states there is a 2-3 cm range, where the spot disappears, which means that the lighting from both sides is equal. Find the approximate middle of this range and measure its distance from the CFL. Then carefully change the (hot!) incandescent lamp and screw another lamp with a different input in, repeat the process and write a table of the results.
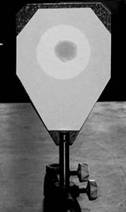
Fig. 5
Table 1 – The results of the experiment with an OSRAM DULUX® EL (15 W – matching the 75 W incandescent lamp). The incandescent lamp was Osram – matte version.
| Lamp’s input (W) |
Distance Photometer - Lamp(cm) |
| 100 |
48 |
| 75 |
51 |
| 60 |
57 |
| 40 |
63 |
| 25 |
72 |
As the table clearly shows, with incandescent lamps of higher input the lighting was balanced closer to the CFL, and with lower input this balance point was closer to the incandescent lamp. Only with the 75 W incandescent lamp the balance point was approximately halfway between the two lights, their lighting intensity is the same. The manufacturer’s data have proven to be true.
The lighting efficiency of a regular light bulb is around 6 %. When a 15 W input CFL equals a 75 W light bulb, its efficiency is around 30 %. The economic value of the CFL is also augmented by the fact that the duration of its use is about twelve times longer than of a light bulb, i.e. 12 000 hours of running time. The input of both lamps can be used to calculate their maintenance costs and compare it with the acquisition cost. However, as the number of CFLs grows, their price is getting lower.
Pupils and students can do this experiment in groups.
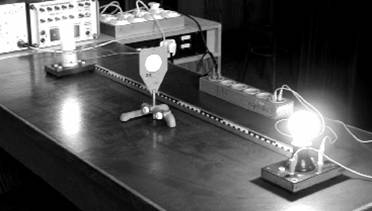
Fig. 7
4. The compact disk (CD)
Optics: reflecting diffraction grating, interference (SS).
Equipment
CD, 40W light bulb, a ruler, a shade with a hole (diameter of the hole approx. 1 cm), stands, a measure, various light sources, stands with sockets, alternatively a laser pointer
Caution: Experiments with lasers are not suitable for students to do on their own. When watching lights with a high percentage of ultraviolet light, a filter must be used, or adequate distance must be put between light source and observer.
You have surely observed how the light reflects from a compact disk (CD), on which music, human voice, or a program was recorded. Why does reflection and diffraction occur on the surface of a CD and what does a CD surface look like? –Information is stored digitally on the surface of a CD in the form of microscopic “pits” or almost straight notches. These are e.g. 0.12 μm deep, 0.6 μm wide and of various lengths. Their length is, however, always a multiple of 0.3 μm and lies between 0.9 μm and 3.3 μm. The notches form a concentric spiral and the spaces between every two notches are also multiples of 0.3 μm and vary from 0.9 μm and 3.3 μm. In the notches of the CD the light is reflected and diffracted, creating a distinct interference pattern.
This means that a CD works as a diffraction grating. Can the grating constant (the distance of two neighbouring rows on a disk), the so called radial distance of two notches? Sit with your back facing a light bulb, positioned at eye level and approximately 2 meters away. Hold the CD in front of your eye, so that the reflection of the light bulb is in the centre of the disk. If you hold the CD around 10 cm away from your eye, you can see concentric circles of various colours. Then, slowly move the CD away from your face, until only the violet part of the frequency remains on the outer edge of the disk. At that point, someone will measure the distance a between your eye and the CD and also the distance r of the violet circle and the centre of the CD. Because we know the violet light wavelength α, we can calculate the grating constant by using the formula \[ d= \alpha \sqrt{1+\frac{a^2}{r^2}} \] with α = 450 nm, a = 17 cm and r = 5.5 cm, then d = 1.5 μm.
Fig. 8
For better realisation of this experiment the light source can be replaced with a laser and the human eye for a shade with a hole in it. The laser beam going through the hole should, if possible, land perpendicularly to the CD on a portion with data encoded. The shade will show fringe patterns of the first and the second order. You can also affix a piece of graph paper to the shade and plot the maximums of the reflected light. With α = 632.8 nm, a = 20 cm and r = 8.8 cm the radial distance of two rows on a CD d = 1.57 μm. The experiment shows that even incomplete rows on a spiral of the disk can cause diffraction, if their radial distance is constant.
CD can be used as a spectrometer as well, e.g. to compare two light sources. Put the light sources to be examined in a row on a table, around 10 cm apart. Pupils will be handed one CD each, and stand approximately 1 meter away from the lights, so that they can see them directly, and with their back turned towards the window, this way the blackouts don’t need to be lowered. They will hold the CDs horizontally, with the data side upwards. Then they will slowly tilt the CDs towards the lights, until spectrums appear. By turning the lights on or off, students can determine which spectrum comes from which light source and compare it to the light of a normal light bulb; e.g. they can discover that some of the wavelengths of a CFL are much brighter or dimmer than those of an incandescent lamp. In the spectrum of a high-pressure lead discharge lamp only orange, green and blue colours will be seen on the CD. Pupils can then learn about the creation of light and the usage of lamps.
5. Photochromic glasses
Absorption (SS)
Equipment
glasses with photochromic lenses, various light sources, e.g. infrared, ultraviolet, a strong discharge lamp etc.
How do glasses with photochromic lenses work? – Expose them to direct sunlight while covering one of the lenses. After a short while go into an unlit room, uncover the other lens and observe the glasses for a minute. What do you see? – The glass exposed to sunlight will have darkened significantly, the covered glass will be still transparent. The darkened glass will become clear in the shadow as well. How quickly did the glass darken and how fast did it return to its normal, light-brown tint, or did it stay completely transparent?
The reversible reaction observed is called photochromism and the glass which manifests these effects is called photochromic. Photochromic glass is made from a combination of glass, boron oxide, enriched with around 1 % of silver, chromium and bromine with a tiny amount of copper. Silver and copper are added usually in the form of nitrates and chlorides. The mixture is heated to 1200°C and a syrup-like melt is created. By cooling down the mixture separate halogen silver crystals containing a small amount of copper are formed. Their diameter is approximately 10 nm, so they can neither interfere with nor block visible light. The glass stays almost transparent and colourless. If, however, there is a notable amount of UV radiation in the light, it is absorbed by the glass. The silver receives electrons from the copper and forms very small grains of metal, which absorb the radiation and the glass darkens. If the UV radiation ceases to act upon the glass, the reaction goes the other way, electrons return from the silver to the copper ions and the metal grains fall apart, thus the glass is transparent again.
The relation of absorption of light by the photochromic glass on time can be measured with an exposure meter or a photodiode connected to an ammeter.
This experiment can be performed during sunny weather and then repeated on a foggy or cloudy day. Even in the classroom various light sources can be used. When exposed to a regular incandescent lamp, which emits only a little ultraviolet light, the glasses don’t darken. The incandescent lamp emits a large amount of infrared light, thereby making the glasses a little lighter in colour. A notable amount of UV light is emitted by e.g. a high-pressure mercury discharge lamp. If exposed to the discharge lamp, the glasses darken even indoors, if exposed to its light. The change in colour of the glasses can also be observed on a shade placed about 50 cm from the photochromic glass. The intensity of light can be changed by moving the glasses closer or further away from the discharge lamp. For quantitative measuring a photometer can be placed behind the glasses and its deflection measured approximately every ten seconds.
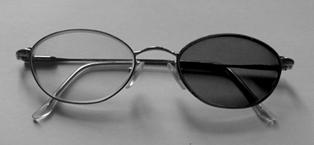
Fig. 9
When exposing the glasses to other light sources you will find that the colouring of the photochromic glass depends on the percentage of UV light in the spectrum of the light sources. During this experiment students should be informed that they are observing direct results of changes in the atomic structure.
Literature
[1] Brockmeyer, H.: Physikalische Eigenschaften phototroper Gläser. Praxis der Naturwissenschaften – Physik, 1981, n. 7, p. 203.
[2] Noeldeke, Ch.: Beugung an einer Compact – Disc. Der mathematisch-naturwissenschaftliche Unterricht 1988, n. 8, p. 502.
[3] Eckert, B., Stetzenbach, H., Jodl, J.: Low Cost – High Tech., Aulis Verlag deubner, Köln 2000.